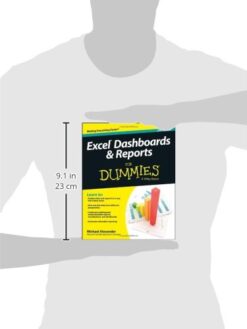
Excel Dashboards Reports Dummies Computers
£21.99 Original price was: £21.99.£1.99Current price is: £1.99.
Product details
Format: Digital Edition
File Size: (22690 KB)
Print Length: 339 pages
Simultaneous Device Usage: None
Publisher: For Dummies; 2 edition 10/03/14
Sold by: Books-For-Everyone Media
Language: English
Text-to-Speech: Not enabled
X-Ray for Textbooks: Enabled
Word Wise: Not Enabled
Enhanced Typesetting: Not Enabled
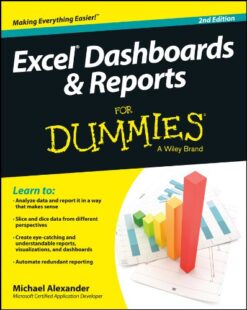
Excel Dashboards and Reports For Dummies, 2nd Edition (For Dummies (Computers)) Paperback – 21 Mar 2014
Create dynamic dashboards and put your data on display with For Dummies
No matter what business you re in, reports have become a staple of the workplace, but what good is a report if no reads it, or even worse, understands it? This all new edition of Excel Dashboards & Reports For Dummies is here to help you make meaning of all your data and turn it into clear and actionable visualisations. Fully updated for the latest business intelligence and spreadsheet tools in Excel 2013, this book shows you how to analyse large amounts of data, quickly slice data into various views on the fly, automate redundant reporting, create eye-catching visualisations, and more. * Helps you move beyond reporting data with simple tables, rows, and columns to designing high-impact reports, dashboards, and visuals * Walks you through a wide array of technical and analytical concepts to give you the background you need to select the right tool for interpreting and displaying data * Covers how to build a chart, work with pivot tables, group and bucket your data, represent trends, create What-If analyses, and increase the value of your reports Excel Dashboards & Reports For Dummies, 2nd Edition is the business analysis tool you need to transform your raw data into a powerful and effective presentation that is accessible to everyone.
Product description
From the Back Cover
Learn to:
- Analyse data and report it in a way that makes sense
- Slice and dice data from different perspectives
- Create eye-catching and understandable reports, visualisations, and dashboards
- Automate redundant reporting
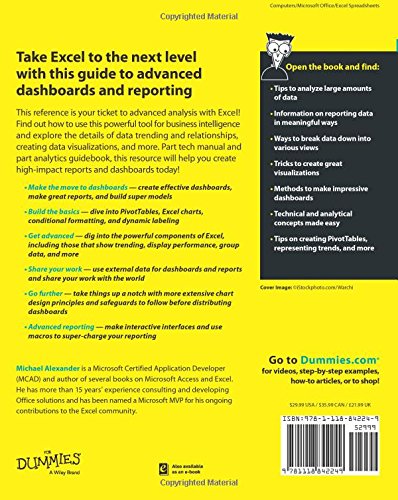
Take Excel to the next level with this guide to advanced dashboards and reporting
This reference is your ticket to advanced analysis with Excel! Find out how to use this powerful tool for business intelligence and explore the details of data trending and relationships, creating data visualisations, and more. Part tech manual and part analytics guidebook, this resource will help you create high-impact reports and dashboards today!
- Make the move to dashboards — create effective dashboards, make great reports, and build super models
- Build the basics — dive into Pivot Tables, Excel charts, conditional formatting, and dynamic labelling
- Get advanced — dig into the powerful components of Excel, including those that show trending, display performance, group data, and more
- Share your work — use external data for dashboards and reports and share your work with the world
- Go further — take things up a notch with more extensive chart design principles and safeguards to follow before distributing dashboards
- Advanced reporting — make interactive interfaces and use macros to super-charge your reporting
Open the book and find:
- Tips to analyse large amounts of data
- Information on reporting data in meaningful ways
- Ways to break data down into various views
- Tricks to create great visualisations
- Methods to make impressive dashboards
- Technical and analytical concepts made easy
- Tips on creating Pivot Tables, representing trends, and more
About the Author
Michael Alexander is a Microsoft Certified Application Developer (MCAD) and author of several books on Microsoft Access and Excel. He has more than 15 years experience consulting and developing Office solutions and has been named a Microsoft MVP for his ongoing contributions to the Excel community.
THIS IS A [Digital Download] of The Book in PDF Form !!!
DIGITAL version of the BOOK
AVAILABLE IN PDF VERSION.
NO SHIPPING!!
NOT THE PHYSICAL BOOK AS HARD BOOK, PAPERBACK…
PLEASE DON’T ORDER IF YOU DON’T REALISE IT
The Link of Book Will Be Instantly Delivered To your email address and Messages Folder eBay After Payment within 24 hours
Works on: Laptops, Desktops, Tablets , Smartphones, Kindle. Thanks!!!!
Be the first to review “Excel Dashboards Reports Dummies Computers” Cancel reply
You must be logged in to post a review.
Related products
Non Fiction
Computing & Information Technology
Data Analysis with Microsoft® Excel®: Updated for Office 2007 [Digital Edition]
Web Development
Computing & Information Technology












Reviews
There are no reviews yet.